How to read an ANOVA summary in R
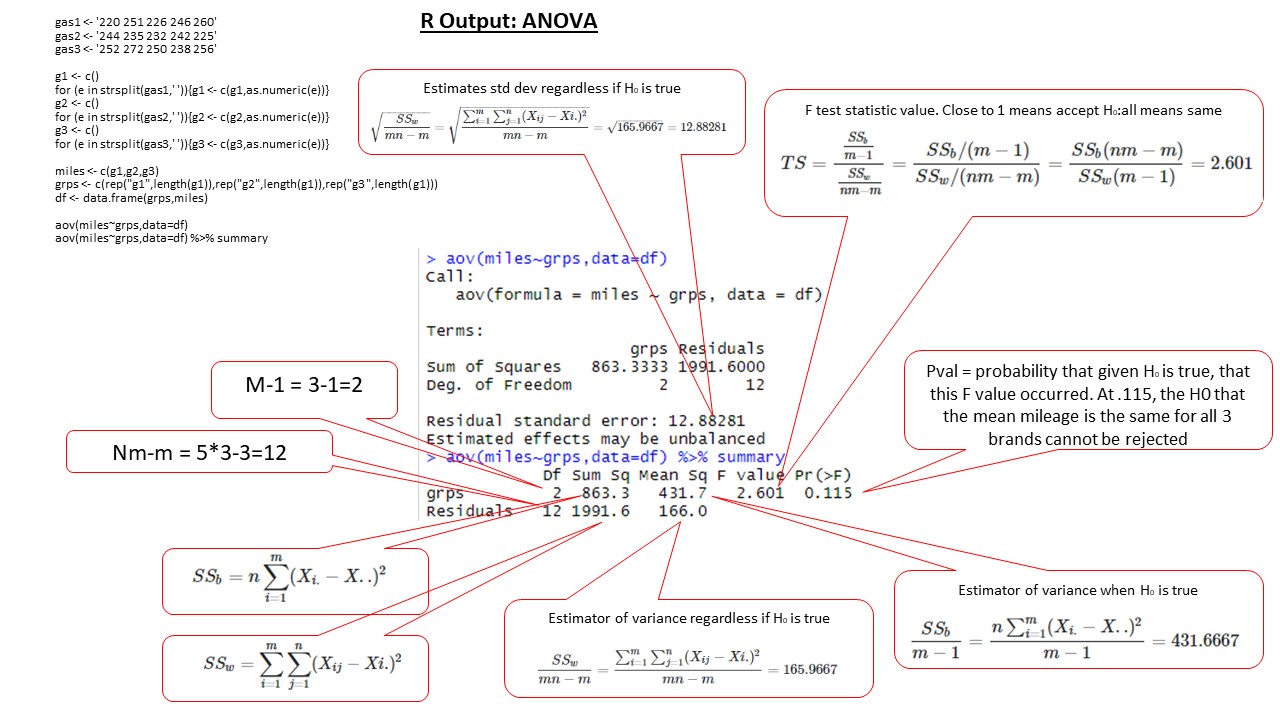
Let's say you want to test three different gasolines to see which yields the best MPG. You get five identical cars and have them drive the same course until they run out of gas. You do this for each gasoline. Probably not good for the environment. Assuming the randomness is Normally distributed, an ANOVA model can be used to assess which gasoline is the best.
After running ANOVA, R provides a lot of useful output. I made my own "legend" on what the output means. Check it out here.
The $p$-value is used to assess the hypothesis that the means are all the same. This is done by calculating variance in two different manners and if there is little difference, then it's more likely that the means are all the same.
Articles
Personal notes I've written over the years.
- When does the Binomial become approximately Normal
- Gambler's ruin problem
- The t-distribution becomes Normal as n increases
- Marcus Aurelius on death
- Proof of the Central Limit Theorem
- Proof of the Strong Law of Large Numbers
- Deriving Multiple Linear Regression
- Safety stock formula derivation
- Derivation of the Normal Distribution
- Comparing means of Normal populations
- Concentrate like a Roman
- How to read a Regression summary in R
- Notes on Expected Value
- How to read an ANOVA summary in R
- The time I lost faith in Expected Value
- Notes on Weighted Linear Regression
- How information can update Conditional Probability
- Coupon collecting singeltons with equal probability
- Coupon collecting with n pulls and different probabilities
- Coupon collecting with different probabilities
- Coupon collecting with equal probability
- Adding Independent Normals Is Normal
- The value of fame during and after life
- Notes on the Beta Distribution
- Notes on the Gamma distribution
- Notes on Conditioning
- Notes on Independence
- A part of society
- Conditional Expectation and Prediction
- Notes on Covariance
- Deriving Simple Linear Regression
- Nature of the body
- Set Theory Basics
- Polynomial Regression
- The Negative Hyper Geometric RV
- Notes on the MVN
- Deriving the Cauchy density function
- Exponential and Geometric relationship
- Joint Distribution of Functions of RVs
- Order Statistics
- The Sample Mean and Sample Variance
- Probability that one RV is greater than another
- St Petersburg Paradox
- Drunk guy by a cliff
- The things that happen to us